Waterverse Command
Daily sales and service performance for leadership
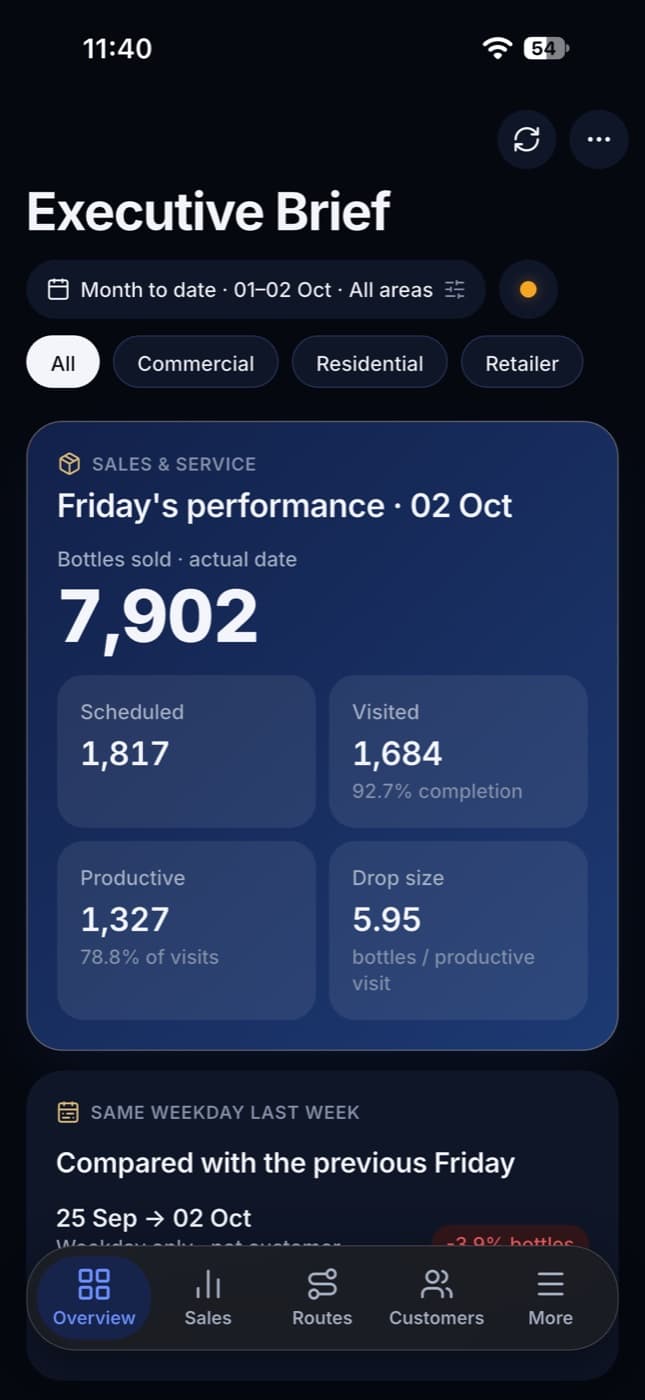
A single dark, high-contrast screen that answers how yesterday went: sales, visits, productivity and the comparison with last week.
About this app
An executive dashboard for Waterverse. It shows bottles sold, scheduled and visited stops, productive visits and drop size for the day, compared with the same weekday last week, and filters by customer type.
What it does
- 01
Daily performance
The headline number for the day: bottles sold, with the actual date shown.
- 02
Scheduled, visited, productive
How many stops were planned, how many were visited, and how many ended in a sale, with completion rates.
- 03
Drop size
Average bottles per productive visit.
- 04
Week-on-week comparison
The day compared with the same weekday last week, so trends are visible immediately.
- 05
Filters
Date range, area and customer type (commercial, residential, retailer).
- 06
Five sections
Overview, Sales, Routes, Customers and More from a persistent bottom bar.